Gallup and U.Michigan way down, Conference Board trending sideways.

Figure 1: U.Michigan Economic Sentiment (blue), Conference Board Confidence Index (brown), Gallup Confidence (green), all demeaned and divided by standard deviation 2021M01-2025m02. NBER defined peak-to-trough recession dates shaded gray. Red dashed line at “Liberation Day” Source: UMichigan, Gallup, Conference Board, NBER, and author’s calculations.
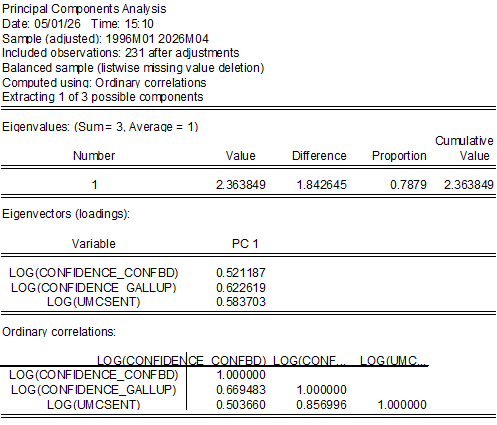
In order to summarize the movements, I calculate the first principal component of all three (logged) indices:
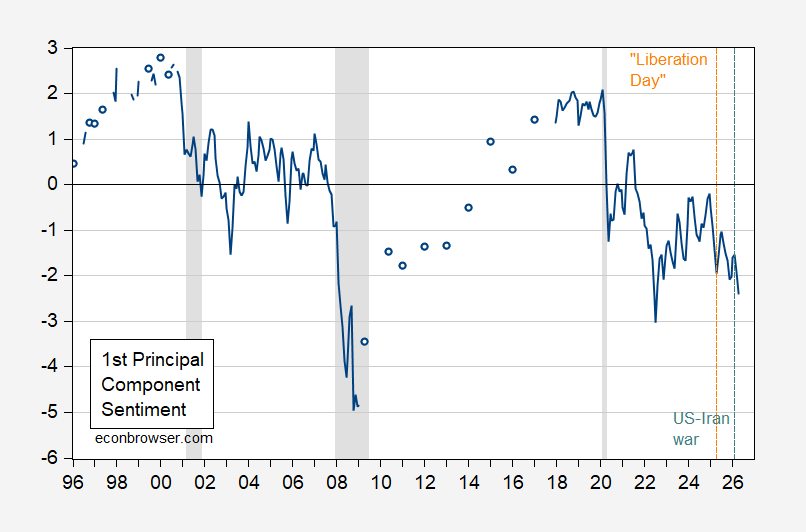
Figure 2: First (unweighted) principal component of U.Michigan, Conference Board, and Gallup consumer confidence/sentiment measures. NBER defined peak-to-trough recession dates shaded gray. Source: UMichigan, Gallup, Conference Board, NBER, and author’s calculations.
Over the 1996M01 period, the Gallup measure has the highest factor loading in the first principal component: